Lithium-ion batteries, one of the most popular electrochemical energy storage systems, have lithium ions as the media to conduct charge through the electrode, electrolyte, and separator inside the cell. Due to the wide application and the need for fast electricity consuming as well as refilling, the battery cell requires a testing method to tell engineers its ability to satisfy the fast charging-discharging. Specifically, the ion diffusion inside the cell is often the bottleneck for porous electrode-based batteries. To measure the ion diffusion kinetics, different methods have been introduced to the electrochemical system, e.g., cyclic voltammetry (CV), electrochemical impedance spectrum (EIS), galvanostatic intermittent titration technique (GITT), and potentiostatic intermittent titration technique (PITT). Among them, GITT is one of the most direct methods to calculate the ion diffusion coefficient. So, GITT is often used to measure the ion diffusion kinetics in many electrochemistry studies [1, 2, 3]. GITT was first used to determine the kinetic parameters of mixed-conducting electrodes Li3Sb, in which it combines both transient and steady-state measures to obtain the chemical and component diffusion coefficients, the partial conductivity, the mobility, the thermodynamic enhancement factor, etc. [4]. The diffusion coefficient was calculated by the following equation:
\[\tilde{D_{i}}=\frac{4}{\pi} (\frac{I_0 V_m}{FS})^2 (\frac{dE/dx}{dE/d\tau^{1/2}})^2\] \[t \ll \frac{L^2}{\tilde{D_i}}\]where \(\tilde{D_{i}}\) (cm2 s-1) is the chemical diffusion coefficient of the studying specie i, \(V_m\)(cm3 mol-1) is the molar volume of active material. \(F\) is the Faraday constant, \(I_0\) is the applied current, \(S\) (cm2) is the contact area between the electrode and the electrolyte, and \(L\) (cm) is the diffusion length. If a sufficiently small current is applied for a short titration time, the \(dE/d\tau^{1/2}\) can be considered as linear. Then equation (1) can be simplified as:
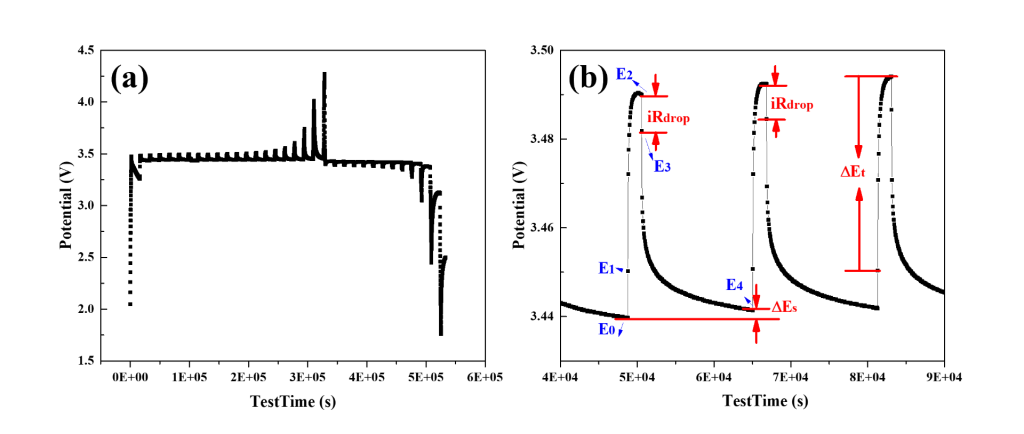
\[\tilde{D_i} = \frac{4}{\pi \tau} (\frac{n_m V_m}{S})^2 (\frac{E_4 - E_0}{E_2 - E_1})^2\]where \(\tau\) (s) is the titration time, \(n_m\) (mol) is the number of moles for the active material chemical diffusion coefficient of the studying specie i. Potentials \(E_0- E_4\) (V) are the potentials at the initial point or end point of the titration period and rest period. In this measurement, a titration of current is applied to the assembled battery cell, which is a pulse current at a constant current density. After each titration step, the cell is allowed to relax for a period. This procedure is repeated until the cut-off potentials (discharge lower bound and charge upper bound) are reached. The test can be easily implemented via an electrochemical workstation or a charge-discharge tester. The exported data would include the test time, current, and potential, which can be plotted as follows (Figure 1). As shown in Figure 1b, the \(\Delta E_s\) is the steady-state potential change \(E_4-E_0\) due to the pulse, and \(\Delta E_t\) is the potential change \(E_2-E_1\) during the pulse current titration. When the current is been switched off, there is an IR drop as \(E_2-E_3\).

Fig. 1. (a) the GITT charge-discharge curves for the LiFePO4 half cell at a current of 0.1 C, titration time=30min, rest time = 4 hrs. (b) the corresponding terminologies from the equation in the curve
Since multiple pulses exist in the charge-discharge process, an ion diffusion coefficient can be calculated with the potentials in each period. To make the calculation simple and efficient, a Python script was prepared to automatically translate the time data and calculate the coefficient with proper parameter settings. The raw data was exported from Landt.exe where time data was formatted as d-hh-mm-ss. There is a blank row between the charge data and the discharge data. The \(E_0, E_1, E_2, E_3, E_4\) can be found for each period to do the coefficient calculation. The \(n_m, V_m, S\) need to be calculated based on the electrode material and the contact area with the electrolyte. With the approximation that narrow particle size distributions surface-area- and volume-based mean approximations are sufficient to predict overvoltage and electrode capacity if kinetic losses are dominated either by the surface reactions or diffusion processes, respectively [5]. The formula for spherical particles can be simplified as [1]:
\[\tilde{D_{i}} = {(\frac{4}{9{\pi}t}{r_p})}^2 {(\frac{E_{4}-E_{0}}{E_{2}-E_{1}})}^2\]Where \(r_p\) represents the particle radius mean. The script is using equation (3) to calculate the coefficients. More detail for the script can be found at Github. By using this script, the GITT calculation for multiple samples becomes efficient and effective.
References
[1] A. Nickol, T. Schied, C. Heubner, M. Schneider, A. Michaelis, M. Bobeth and G. Cuniberti, GITT Analysis of Lithium Insertion Cathodes for Determining the Lithium Diffusion Coefficient at Low Temperature: Challenges and Pitfalls, J. Electrochem. Soc. 167 (2020) 090546.
[2] Z. Liu, D. Lu, W. Wang, L. Yue, J. Zhu, L. Zhao, H. Zheng, J. Wang and Y. Li, Integrating Dually Encapsulated Si Architecture and Dense Structural Engineering for Ultrahigh Volumetric and Areal Capacity of Lithium Storage, ACS Nano 16 (2022) 4642-4653.
[3] K. Tang, X. Yu, J. Sun, H. Li and X. Huang, Kinetic analysis on LiFePO4 thin films by CV, GITT, and EIS, Electrochimica Acta 56 (2011) 4869-4875.
[4] W. Weppner and R. A. Huggins, Determination of the Kinetic Parameters of Mixed Conducting Electrodes and Application to the System Li3Sb, J. Electrochem. Soc. 124 (1977) 1569.
[5] F. R\({\"o}\)der, S. Sonntag, D. Schr\({\"o}\)der and U. Krewer, Simulating the Impact of Particle Size Distribution on the Performance of Graphite Electrodes in Lithium Ion Batteries, Energy Technology 4 (2016) 1588-1597.