In battery test, the charge-discharge data is one of the most important performance to present how good a battery is. In particular, a batch of batteries are tested at the same time with the same testing profile in a battery lab. Therefore, it is very necessary to process these data efficiently. I developed a python-based tool which can batch process a group of battery charge-discharge testing data and plot them for a better comparison. The cycling scatters with both Specific capacity and Coulombic efficiency as the y variables, the charge-discharge curves as Voltage vs. Capacity, and the statistic table of initial Coulombic efficiency & reversible Coulombic efficiency are all analyzed at one click. This tool saves a lot of data processing time, especially for these high throughput experiments.
Introduction
As a battery researcher, processing battery testing data is one of boring tasks and takes lots of time. Although the professional software (Origin, Sigmaplot etc.) are often used to analyze battery data, it still takes time to plot a batch of battery data at one moment. Python, as a code language, is easy to handle while processing experimental data. By building a data processing platform, a flexible plotting tool can be achieved to help researchers save time on battery data analysis. The platform can be modified to meet different sample comparison requirements. It is possible to setup a database and store the comparison results in a clean format. It is also the goal of this tool development which might contributes to the data powered battery manufacturing optimization project. But the included demonstration and code are only at the starting to this destination.
Data processing
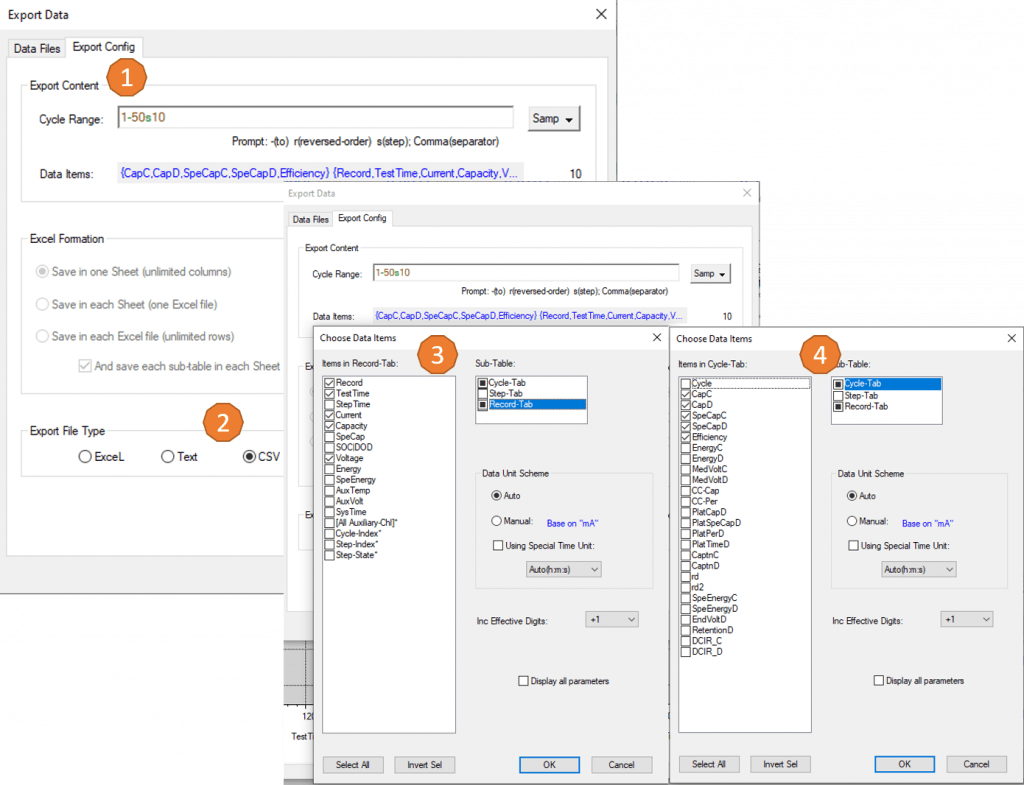
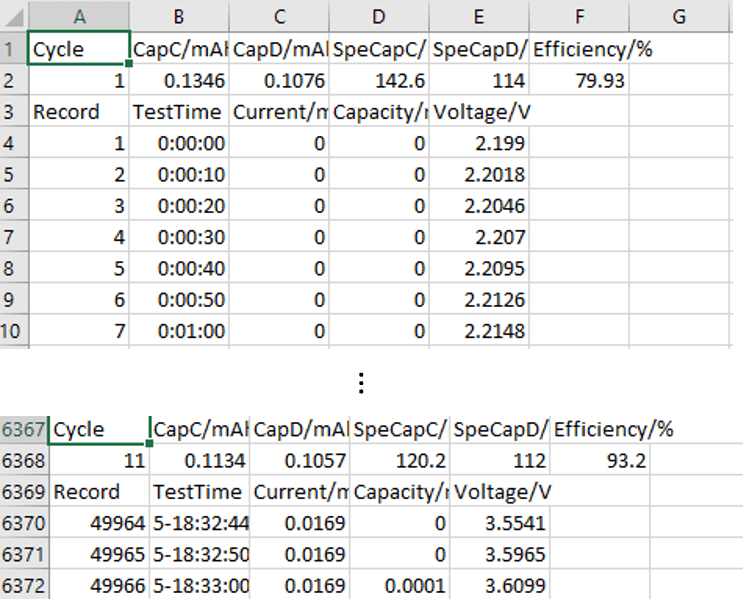
The data is derived from the Landt.exe (Figure 1) and results in the following .csv Format (Figure 2). When exporting data from the Landt.exe, the testing profiles are set as taking CapC, CapD, SpeCapC, SpeCapD, and Efficiency for each cycle and selecting TestTime, Current, Capacity, and Voltage in each record. Beyond, try to export the testing data with the same running cycles to have a better comparison, but it is not required. Then, rename these exported .csv files with the sample names which are expected to appear in the final figures. Move these .csv files into one empty folder for the batch processing.

Fig. 1. Data export from Landt.exe

Fig. 2. The format of the exported .csv files
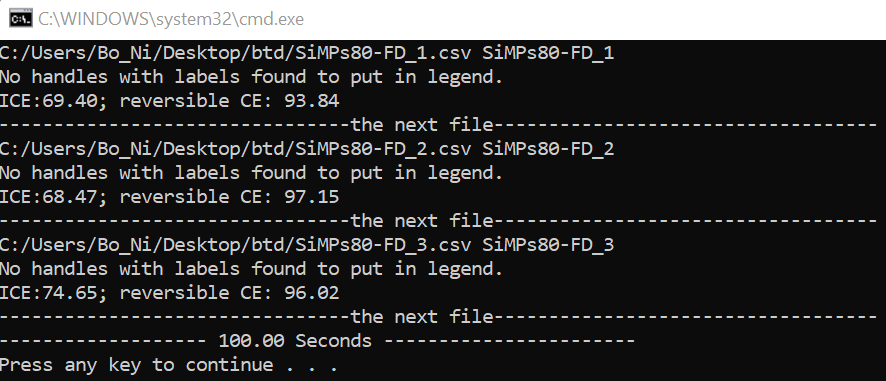
By dropping these files in one folder, the python code can locate the file root and read the data one by one. The data is firstly cleaned to drag effective numbers for later figure plotting. The plotting functions in the cycling.py contains cycling_curve and cycle_stat which draw the charge-discharge curves and cyclic stability scatters, respectively. In the data_process function, the coulombic efficiency in the first cycle or the later reversible cycles are listed as well. So, based on these simple functions, the plots can be done in a quick response after one click. From Figure 3, we can easily see the plotting for three battery testing files only takes 100 seconds which is much faster than using the commercial plotting software.

Fig. 3. The simulation of the demo for changing the layer thickness

Fig. 4. The *Discharge-charge curves* of the select batteries

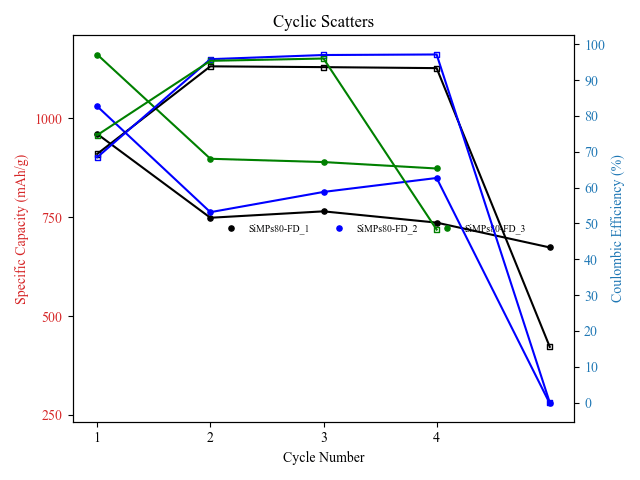
Fig. 5. The *Cyclic scatters* for battery comparison
As seen, Figure 4 represents three discharge-charge curves for the silicon-based anode material. The drawn curves are denoted to the specific cycles they are corresponding to. The selected cycles vary with the total number of cycles from the exported testing files. For example, it can be cycle #1, #2, #3, #4 or cycle #1, #2, #5, #10, #50, #100 etc. The details can be seen from the code. The cyclic scatters in Figure 5 are also plotted to compare the samples so the researchers can figure out the battery working tendencies for the capacity decay and coulombic efficiency.
This python-based battery plotting tool is easy to use. The code is also easy to rewrite to follow other plotting requirements. This code is also uploaded to the Github: Battery-Testing-Data-Batch-Plotting.